This year’s gender pay gap report highlights a mix of progress and areas for improvement. While the overall pay gap has increased, there are several positive trends that reflect our ongoing commitment to equity and inclusion.
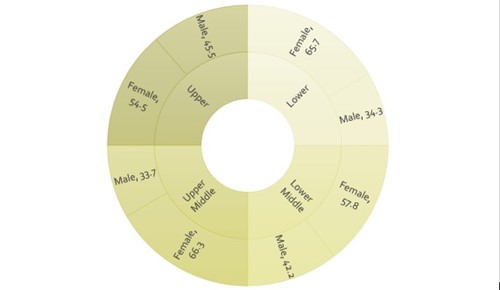
With our clients trusting us to provide more high quality managerial and team leader positions, we have seen a year-on-year increase of the number of women in the upper two quartiles, ensuring the right people get into these positions.
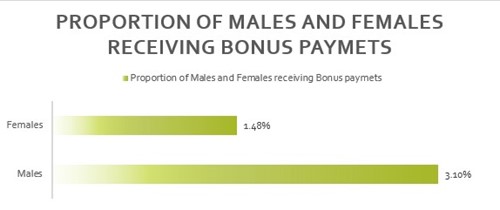
The decrease in the bonus pay gap is a notable achievement, with a higher proportion of both men and women received bonus pay this year.
We are an employer required by law to carry out Gender Pay Gap Reporting under the Equality Act 2010 (Gender Pay Gap Information) Regulations 2017.
This report confirms the situation in the pay period in which 5 April 2024 (the ‘snapshot’ date) fell and is based upon the information contained within our HR and payroll records in that period. We will publish this report on our own website and the government’s Equality Office website. The figures below show the difference between the average earnings of men and women in our organisation.
This is the difference in the average hourly rates of pay for men and women. It adds up all the hourly rates of pay for men and all the hourly rates of pay for women and divides each by the number of men or women in scope. It then looks at the difference.
This orders’ the hourly rates of pay for men and women from the lowest to the highest and then compares the middle value.
Mean Average Pay Gap |
Median Average Pay Gap |
|
6.14% |
0.6% |
Mean Bonus Pay Gender Gap |
Median Bonus Pay Gender Gap |
71.9% |
62.5% |
We are working with our clients to offer more bonus scheme to aid in retention and further develop staff skills.